Here are a few tips on how you can easily estimate the suction and discharge production of dredging and mining equipment yourself. It is easier than it looks! Taking the time to learn how to do this could save you millions of dollars down the line. Creating your own estimate will also greatly increase your understanding of upcoming projects. This insight is crucial for the timely delivery of projects as well as procuring or mobilising suitable equipment or contractors to site.
These tips and tricks will make it easier for you:
1. Convert units
The input of the Pumps ‘n Pipeline (PnP) tool comes in both metric and US imperial units. You no longer need to find the conversion factor and correct prefix. If the unit is uncommon, you can always use the free offline tool Convert for Windows and Linux.
2. Take screen shots from the head, efficiency and NPSHr pump curves
The Windows Snipping Tool can take screenshots and save them as pictures in PNG format. Note that the Nett Positive Suction Head required (NPSHr) curve is only needed for the first pump and is an optional input in PnP.
3. Digitise head, efficiency and NPSHr pump curves
You can digitise the pictures of the curves using WebPlotDigitizer, a free online tool. Make sure you collect at least five data points for each curve. Export data as *.csv in WebPlotDigitizer. PnP can import tab, space or comma delimited files.
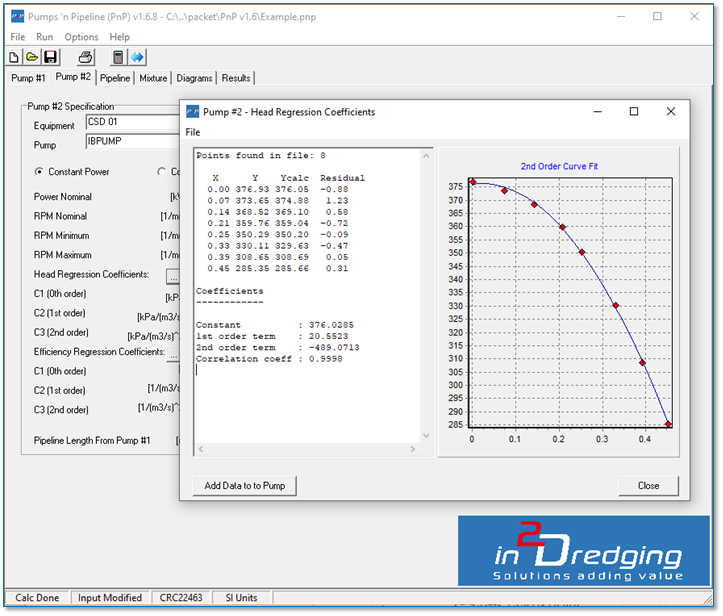
4. Find the regression coefficients
In Pumps ‘n Pipeline (PnP) version 1.6.8 you can import any tab, space or comma delimited text file containing flow versus head, flow versus efficiency or flow versus Nett Positive Suction Head data. Next PnP will perform the curve fit and determine the regression coefficients. These coefficients can then be automatically copied to the relevant Pump tab, thus eliminating the chances of data entry errors.
5. Fill in PnP’s Pumps tab
Now you can fill in the rest of the fields on the first Pumps tab. Besides the regression coefficients, you’ll also need to provide values for the pumps and drives, such as power and revolutions.
6. Fill in PnP’s Pipeline tab
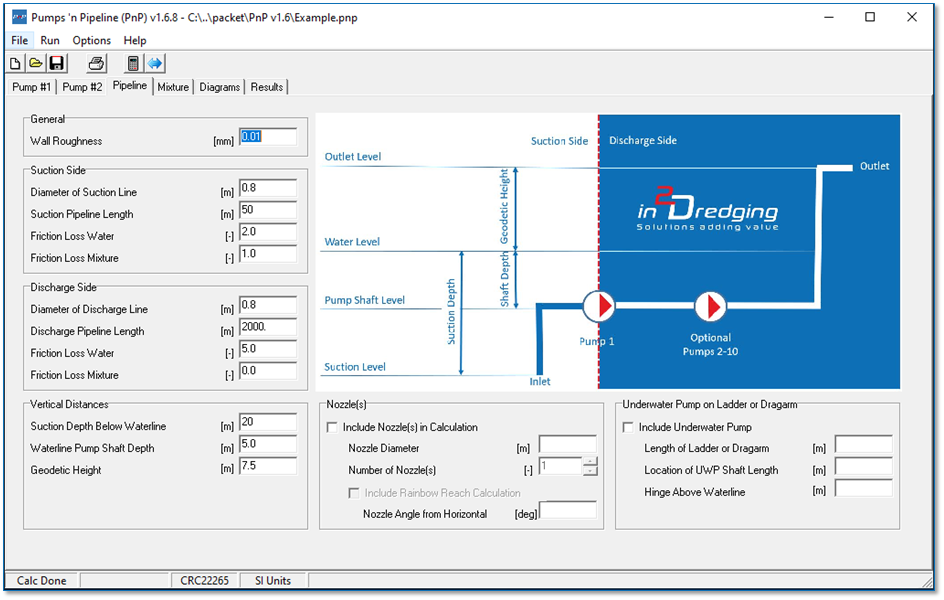
Provide the length and diameters of the pipeline on both the suction and discharge side. Typical friction loss coefficients are provided in the Pumps ‘n Pipeline (PnP) v1.6 User Manual.
The new sub menus Nozzle(s) and Underwater Pump on Ladder or Dragarm provide additional features that help you simulate, for example, rainbowing and dredging in shallow water with an underwater pump. Tip: When suction production is the limiting factor or bottleneck, then the vertical distances need to be filled in accurately. One-tenth of a meter can significantly impact suction production, but will not considerably affect your pipeline pressure loss
7. Fill in the PnP’s Mixture tab
Fill in the properties of your mixture such as densities, temperature and particle sizes. If these values are unknown, the Pumps ‘n Pipeline (PnP) v1.6 User Manual can provide typical value ranges.
Tip: Make sure the geotechnical site investigation provides sufficient definition on mixture properties, or else ensure your assumptions are clearly flagged
8. Fill in PnP’s Diagram tab
Provide the value range for the calculation and how you want to view your results. The range typically depends on the pump curves.
9. Calculate results
All done! Press on the calculator icon and analyse the results. All results can be viewed as easy to read graphs.
If you are not sure about your results, contact us as we are keen to learn about your projects and very passionate about estimating dredging production. If that is still too much work, provide us with the required input data and we will do it all for you!