
How Pumps and Pipeline Estimating Tool Works
Recently, in2Dredging developed Pumps and Pipeline (PnP) estimating tool that can accurately estimate the suction and discharge production of any dredging or mining equipment that hydraulically transports soil like materials. In this post, the results of PnP are chronologically introduced to explain on a high level how PnP works. It starts with a single pump, introduces the pipeline and then more complex graphs are shown to provide the estimator with the necessary insight in the interaction between pump, pipeline and soil mixture. PnP calculates a realistic production level taking all relevant production limitations into account.
PnP can be practically used to:
- Design pump-drive systems;
- Select feasibility of dredging or mining equipment for a project;
- Estimate suction and discharge productions for a project;
- Evaluate performance of pump-drive systems.
Pump Behaviour
The pump behaviour is best described with second order polynomials. Five operating water-pumping points are ideal for constructing the polynomials that describe the pump head and pump efficiency flowrate. Figure 1 shows the regression analysis and the coefficients found for the operating points.
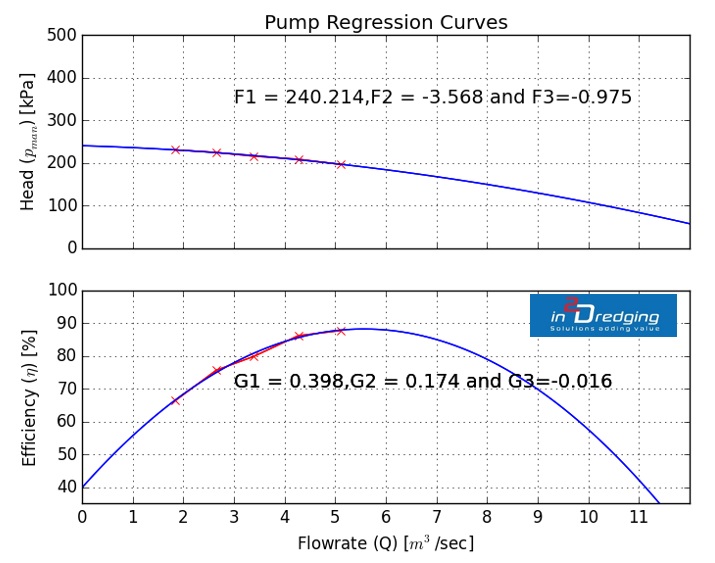
Figure 1 Polynomial fitting on pump’s operating points.
The polynomials found with regression analysis enable the calculation of the pump characteristics for the revolution range of the pump-drive system and for any mixture density.
The behaviour of each pump is described concisely and completely with three graphs as shown in Figure 2. The top graph shows the power at the shaft. This particular drive system has a constant speed and constant power region. The middle graph shows the efficiency of the pump converting the power at the shaft into flow and pressure (hydraulic power). The bottom graph shows the flowrate and head for the revolution range of the drive. Several empirical relations are used to estimate the pump behaviour. Those relations have been selected, developed and calibrated over decades of field measurements to provide robust and realistic estimates time after time.
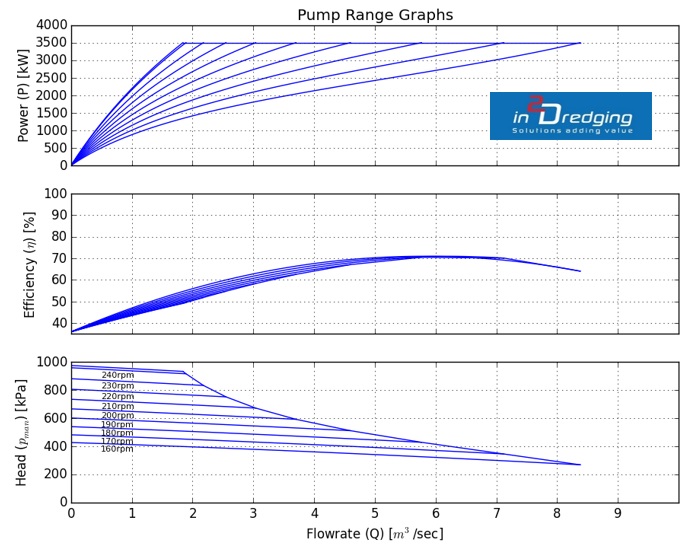
Figure 2 Pump characteristics for pump-drive system revolutions range and a specific mixture density.
Introducing the pipeline
Now the pump behaviour has been simulated it becomes possible to introduce the pipeline. The pressure loss in the pipeline is a function of pipeline configuration and mixture properties. Figure 3 shows the pump characteristic for the constant speed and constant power region for a mixture density range of 1,025 to 1,600 kg/m3. The same range of density is applied to the pipeline characteristics. The intersection points between the pipeline and pump are referred to as the operating point. The graph below provides a clear understanding of the performance of the pump and pipeline system.
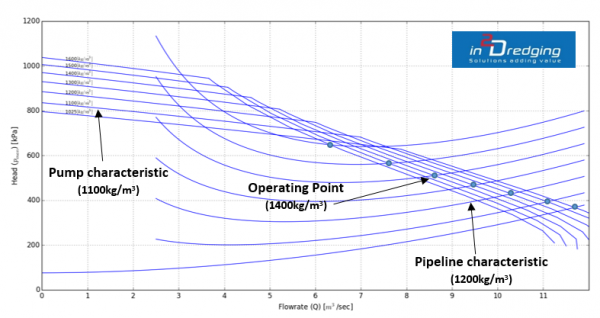
Figure 3 Pumps and pipeline characteristics for a range of mixture densities.
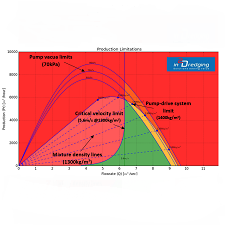
Production limitations
The production limitations are illustrated in Figure 4 with the flowrate on the horizontal axis and the production rate on the vertical axis. Colours show the working areas which are possible (green), challenging (orange) and impossible (red). Three parabolas show the limiting pump vacua ranges (60 to 80kPa). Dashed lines show the production for a range of mixture densities. The maximum production rate physically achievable for a mixture density with the pump-drive system is indicated with blue dots. The blue dots are connected by a blue line to show the production envelope of the pump-drive system. The production estimator interprets the mixture densities to understand whether forming these mixture densities is feasible. For instance high mixture densities can be expected when self-emptying a hopper, but mixture densities are typically lower when dredging fine sand.
The critical velocity is shown with a blue line, which depends on the mixture density. Below the critical velocity, a sand bed forms at the bottom of the pipeline, which increases the pressure losses over the pipeline. Mixture velocities below critical velocity are typically undesirable and rated by PnP as impossible.
The production limitation graph (Figure 4) shows at a glance the achievable production rates (<6,000m3/hr) and limiting factors. Mixture densities just above 1,400kg/m3 result in the maximum achievable production. The mixture velocity has to stay above 5.6m/s. In this particular case the production is limited by the pump-drive system and might also be limited by the pump vacuum.
i2D can train your estimators to understand your pump and pipeline system to deliver reliable and robust production estimates. i2D can also train your operators to recognise production limitations and realise maximum possible production.
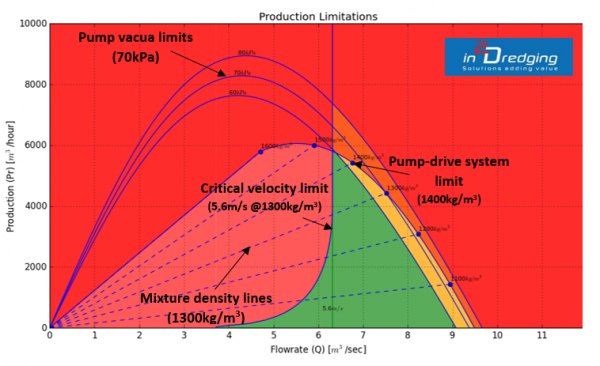
Figure 4 Production limitations by pump-drive system, critical velocity, mixture density forming and vacuum.
Discharge Pipeline lengths
The discharge production limitation is shown in Figure 5. The graph shows the production achievable for a range of pipeline lengths and for several mixture densities. The lines are constructed by calculating the operating points for all pipeline lengths. This graph saves the estimator time as the powerful estimating tool PnP automatically calculates all operating points for a complete range of pipeline lengths. Experience has shown that this graph is extremely valuable when pumping mixture over a significant distance.
As illustrated in Figure 5, if the project involves a pipeline length of 4,000m then the discharge production limitation graph shows a maximum production rate of approximately 2,500m3/hr can be achieved. The maximum mixture density to be pumped is approximately 1,200kg/m3.
This information can:
- Provide operators at the start of the project the maximum mixture density, which is the key to reducing the learning curve of the project.
- Demonstrate how introducing another pump unit such as a booster could increase the production rate. The graph below gives insight into the benefits of a booster pump.
- Calculate the feasibility of hydraulically transporting material to e.g. a reclamation area.
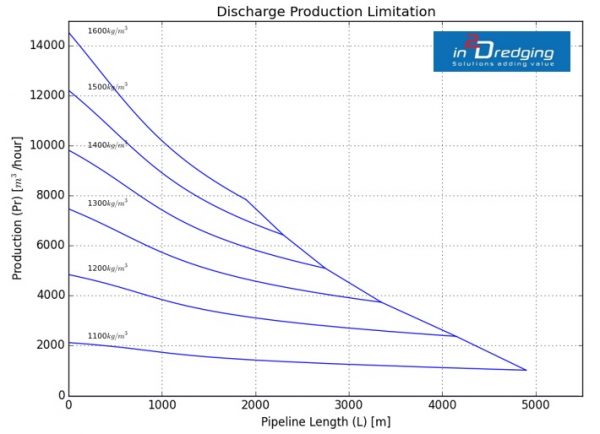
Figure 5 Discharge production limitation for pipeline length
i2D can perform quick and reliable discharge and suction production estimates as the estimating tool PnP automates the estimating process. Each module of Pumps and Pipeline (PnP) has been extensively verified, calibrated and validated. PnP uses expertise from decades of simulating and estimating pumping soil mixtures through pipelines.
Cost per cubic metre
PnP’s modular software can be easily integrated into the design process for modifying or building your dredging equipment. You can rely on PnP as a powerful estimating tool to optimise your dredging equipment and deliver the lowest cost per cubic metre.